


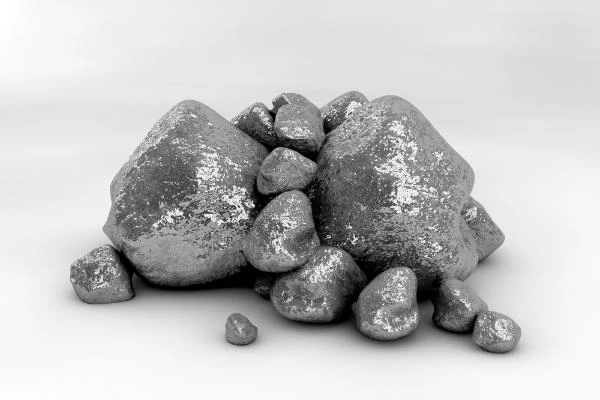
On June 29, 2025, IndexBox released a comprehensive report detailing the dynamics of the European Union’s silver market, including silver plated with gold or platinum. This report highlights a promising outlook for the silver market, projecting a compound annual growth rate (CAGR) of +1.3% in volume and +2.0% in value from 2024 to 2035. By the end of this period, the market volume is expected to reach 12,000 tons, with a total value of approximately $8 billion.
Market Forecast
The silver market in the EU is poised for growth, driven by increasing demand across various sectors. The anticipated CAGR of +1.3% in volume indicates a steady rise in consumption, while the +2.0% growth in value reflects the rising prices and demand for silver. This upward trend is expected to culminate in a market volume of 12,000 tons and a market value of $8 billion by 2035.
Consumption Trends
Overview of Consumption
In 2024, the consumption of silver, including silver plated with gold or platinum, rebounded to 10,000 tons after two years of decline. Despite this recovery, the overall consumption trend has remained relatively flat, with a peak volume of 14,000 tons recorded in previous years. The revenue generated from the silver market surged to $6.4 billion in 2024, marking an 18% increase from the previous year. This figure encompasses the total revenues of producers and importers, excluding logistics and retail costs.
Country-Specific Consumption
The countries leading in silver consumption in 2024 were Germany (2,100 tons), Italy (1,900 tons), and Spain (1,100 tons), collectively accounting for 50% of total consumption. Other notable countries included Belgium, Poland, France, the Netherlands, the Czech Republic, Portugal, and Greece, which together contributed an additional 35%.
Belgium exhibited the most significant growth rate in consumption among the main consuming countries, with a CAGR of +8.1% from 2013 to 2024. In terms of market value, Italy ($1.5 billion), Germany ($1.2 billion), and Spain ($727 million) dominated, representing 54% of the total market.
Per Capita Consumption
Per capita consumption figures reveal interesting insights, with Belgium leading at 70 kg per 1,000 persons, followed by the Czech Republic (38 kg) and Portugal (31 kg). Belgium also recorded the highest growth rate in per capita consumption, with a CAGR of +7.7%.
Production Insights
Overview of Production
In 2024, the production of silver, including silver plated with gold or platinum, saw a significant increase of 21%, reaching 12,000 tons. This growth follows two years of decline and reflects a modest overall expansion in production. The peak production volume was recorded at 15,000 tons in 2021, but subsequent years saw a decline until this recent recovery.
In value terms, silver production skyrocketed to $8.1 billion in 2024, reflecting an average annual growth rate of +1.6% from 2013 to 2024. The production value peaked at $9.9 billion in 2021, but has since stabilized at lower levels.
Leading Production Countries
Germany (3,600 tons), Poland (2,200 tons), and Italy (2,100 tons) were the top producers in 2024, together accounting for 67% of total production. Hungary exhibited the most notable growth rate in production, with a CAGR of +11.7% over the review period.
Import and Export Dynamics
Import Trends
In 2024, the EU’s imports of silver, including silver plated with gold or platinum, decreased by 24.7% to 6,300 tons, marking a decline for the second consecutive year. The value of imports also dropped significantly to $2.6 billion. Belgium, Germany, France, Italy, and Poland were the leading importers, collectively accounting for 85% of total imports.
Export Trends
Conversely, silver exports from the EU decreased slightly by 2.9% to 8,000 tons in 2024, following a period of growth. In value terms, exports expanded slightly to $5.1 billion. Germany and Poland were the leading exporters, representing roughly 56% of total exports.
Pricing Insights
Import Prices
In 2024, the average import price in the EU was $406,912 per ton, reflecting a 6.1% decrease from the previous year. Notably, Italy had the highest import price at $880,047 per ton, while Poland recorded one of the lowest at $76,547 per ton.
Export Prices
The export price in the EU rose to $643,006 per ton in 2024, indicating a 6.6% increase from the previous year. Sweden had the highest export price at $1,018,578 per ton, while France’s export price was among the lowest at $300,829 per ton.
Conclusion
The EU silver market is on a positive trajectory, with increasing consumption and production expected to drive growth in the coming years. As demand continues to rise, particularly in key markets like Germany, Italy, and Belgium, the silver industry is poised for a robust future. Stakeholders should remain vigilant to market trends and shifts in consumer preferences to capitalize on the opportunities within this evolving landscape.
For more detailed insights, the full report can be accessed through IndexBox.



 English