
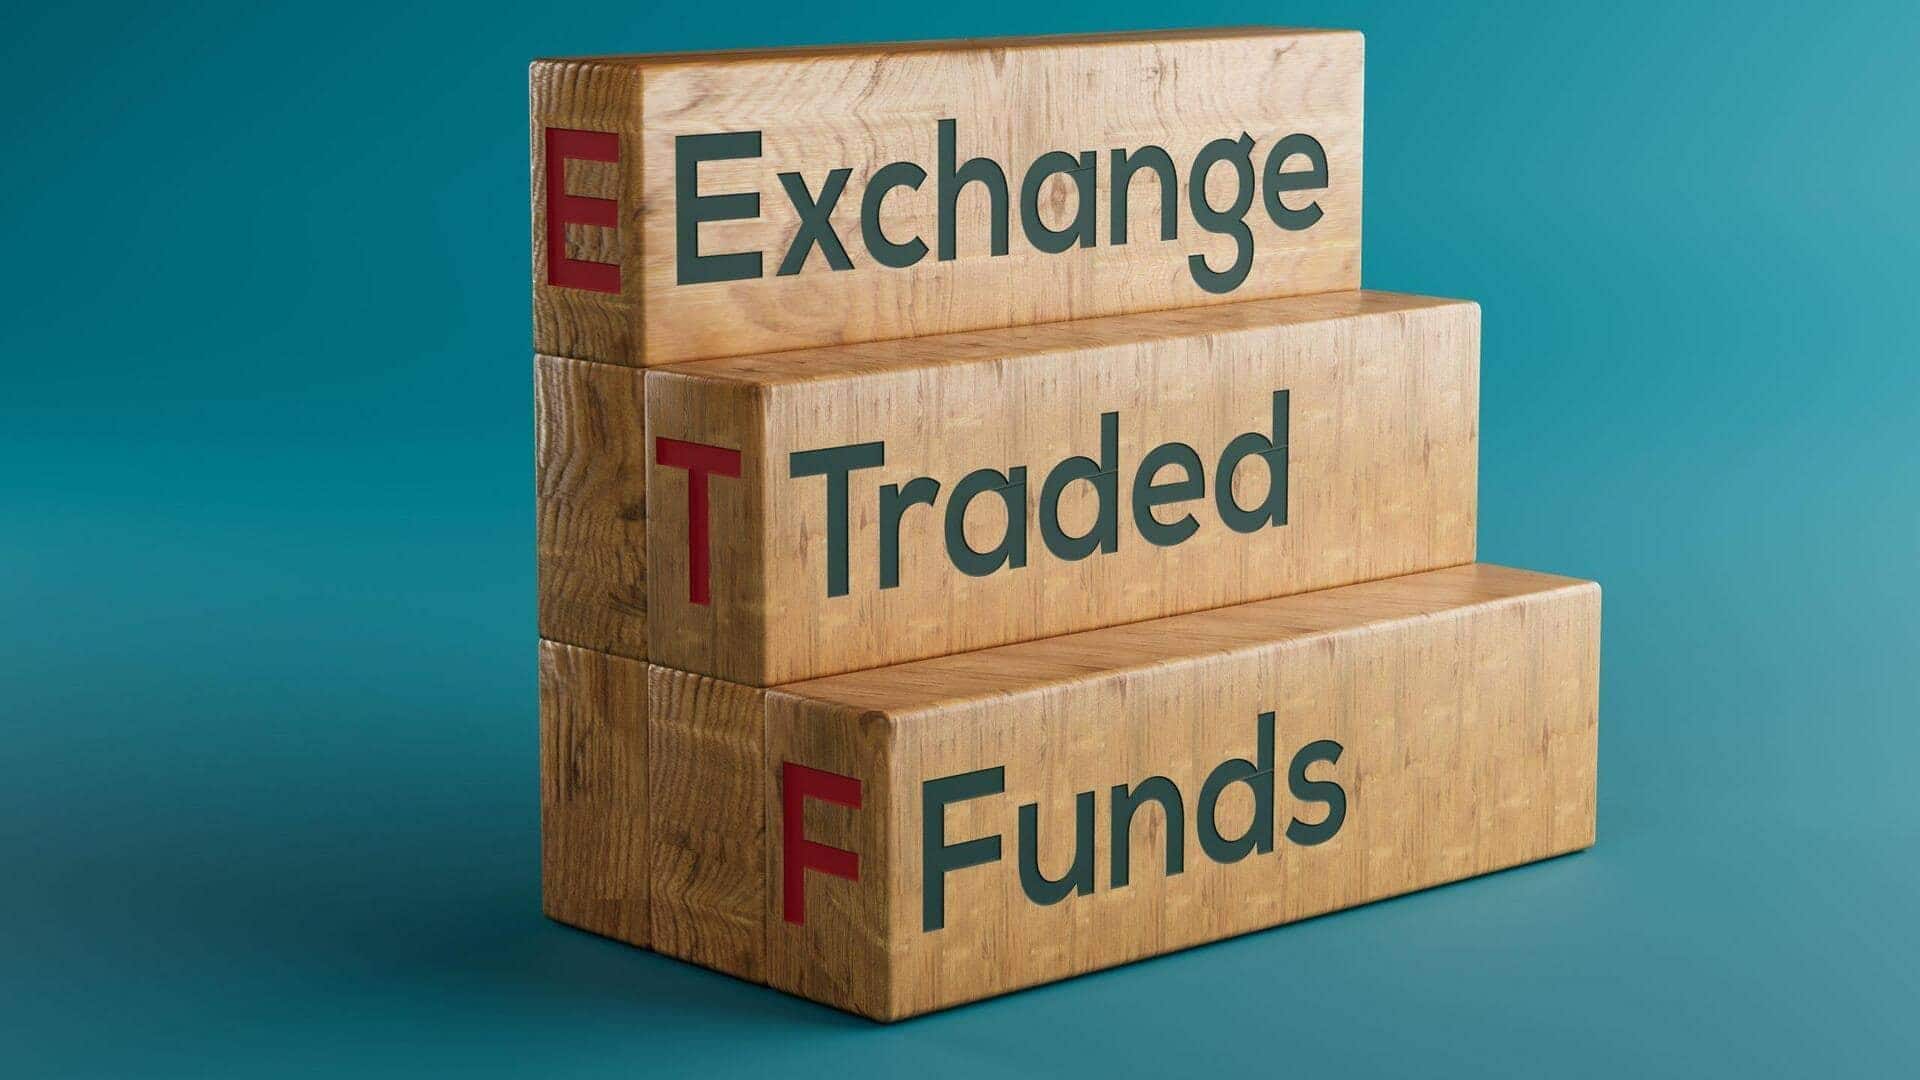
In a remarkable turn of events, the combined assets under management (AUM) of gold and silver exchange-traded funds (ETFs) have soared to unprecedented heights, reaching over ₹3 lakh crore in January 2026. This surge marks a staggering increase from around ₹1 lakh crore just five months earlier in August 2025. The growth is not merely a statistical anomaly; it reflects a significant shift in investor sentiment and behavior amidst a backdrop of market volatility and economic uncertainty.
Record Growth in Investor Participation
The dramatic rise in AUM has been accompanied by a notable increase in investor participation. According to data from the Association of Mutual Funds in India (AMFI), the number of gold ETF folios jumped from 80.34 lakh to 1.14 crore, while silver ETF folios skyrocketed from 11.31 lakh to an astonishing 47.85 lakh during this period. This translates to a growth of 43% for gold and a staggering 323% for silver ETFs. Such figures underscore a growing recognition among investors of the value of precious metals as a viable investment option.
A Shift in Inflows: Precious Metals Outperform Equities
January 2026 witnessed record inflows into gold and silver ETFs, with gold attracting over ₹24,039 crore and silver drawing in ₹9,463 crore. Notably, these inflows surpassed those of equity funds, which saw inflows of ₹24,029 crore during the same period. This shift is particularly telling, as it indicates a growing preference for the perceived safety of precious metals over the more volatile equity markets. In December 2025, inflows into gold and silver ETFs were also robust, totaling ₹15,609 crore, compared to equity funds’ ₹28,055 crore, marking a trend of moderation in equity flows.
Understanding the Market Dynamics
Ajay Garg, CEO of SMC Global Securities, emphasizes that the surge in gold and silver inflows should not be interpreted as a precursor to an equity market correction. Instead, he suggests that investors are reallocating their portfolios toward defensive assets in response to ongoing market volatility and macroeconomic uncertainties. Garg recommends that long-term investors maintain a disciplined allocation of 10-15% in gold and silver to mitigate risks associated with over-concentration in any single asset class.
Strategic Investment Approaches
To navigate the current market landscape, Garg advises investors to consider staggered allocations through systematic investment plans (SIPs) or phased ETF investments rather than making lump-sum purchases at high levels. This strategy allows investors to average their costs and reduce the impact of market fluctuations. As global trade uncertainties begin to ease and foreign investments gradually return, Garg believes that Indian equities could stabilize, making a balanced portfolio of equities and precious metals a prudent approach.
Factors Driving Demand for Gold
The surge in inflows into gold ETFs can be attributed to several factors, including policy uncertainties, a relatively weaker dollar, and speculation regarding the future direction of U.S. Federal Reserve policy. Domestically, uncertainties surrounding the India-U.S. trade relationship and persistent foreign investor outflows have led many to view gold as a defensive strategy. Additionally, silver ETFs have gained traction due to last year’s sharp rally in silver prices and overall fund performance, further driving investor interest.
Conclusion
The remarkable growth in the AUM of gold and silver ETFs reflects a significant shift in investor behavior and sentiment. As economic uncertainties loom large, precious metals have emerged as a favored asset class, attracting record inflows and participation. For investors, this trend underscores the importance of diversification and strategic allocation in navigating an increasingly complex financial landscape. As we move forward, the interplay between equities and precious metals will continue to shape investment strategies, making it essential for investors to stay informed and adaptable.


 English