October 25, 2025, 03:11 AM ET
By Thomas H. Kee Jr, Editor, Stock Traders Daily | Editor: Derek Curry
Follow on LinkedIn
In the ever-evolving landscape of financial markets, having a robust trading plan is crucial for long-term success. This article delves into the current trading strategies for the BetaPro Gold Bullion 2x Daily Bull ETF (GLDU:CA), providing insights and recommendations for traders looking to navigate this dynamic sector.
Current Trading Strategy
Long-Term Buy Signal
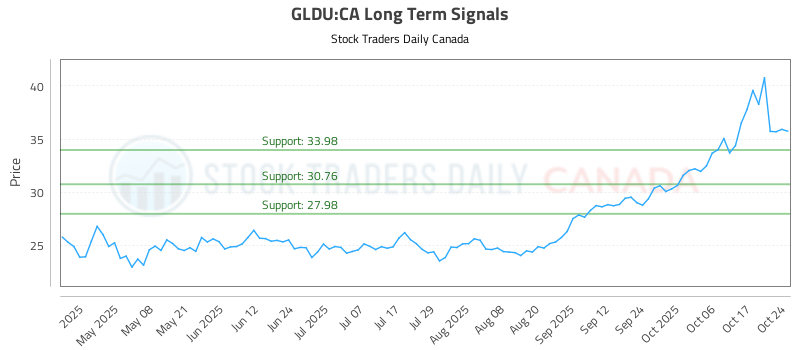
For traders interested in GLDU:CA, the current recommendation is to buy near 33.98. This price point has been identified as a strategic entry level, allowing investors to capitalize on potential upward movements in the ETF.
Target Price: Not specified at this time, indicating a focus on long-term growth rather than short-term gains.
Stop Loss: Set at 33.81, providing a safety net for investors should the market move unfavorably. This stop loss is crucial for risk management, ensuring that losses are contained.
Absence of Short Plans
At this juncture, there are no short plans offered for GLDU:CA. This absence suggests a bullish sentiment among analysts, indicating that the current market conditions are not favorable for short-selling. Traders should remain vigilant, as market dynamics can shift rapidly.
AI-Generated Signals
The integration of artificial intelligence in trading strategies has become increasingly prevalent, offering traders data-driven insights. The latest AI-generated signals for GLDU:CA provide a comprehensive overview of its performance across different time frames:
Ratings Overview for October 25:
Term
Near
Mid
Long
Rating
Weak
Strong
Strong
Near Term: The weak rating suggests caution for short-term traders, indicating potential volatility or a lack of momentum.
Mid Term: A strong rating indicates positive sentiment and potential growth in the medium term, making it an attractive option for investors looking to hold for several weeks.
Long Term: Similarly, the strong rating in the long term reinforces the bullish outlook, suggesting that GLDU:CA may be well-positioned for sustained growth.
Chart Analysis
For a visual representation of GLDU:CA’s performance, traders can refer to the chart available here. Analyzing charts can provide valuable insights into price trends, support and resistance levels, and overall market sentiment.
Conclusion
As of October 25, 2025, the trading landscape for GLDU:CA presents a compelling opportunity for long-term investors. With a clear buy signal, a defined stop loss, and strong mid- to long-term ratings, traders can approach this ETF with confidence. However, it is essential to remain informed and adaptable, as market conditions can change rapidly.
For ongoing updates and AI-generated signals, traders are encouraged to check the latest data here. By staying informed and following a disciplined trading plan, investors can navigate the complexities of the market effectively.


