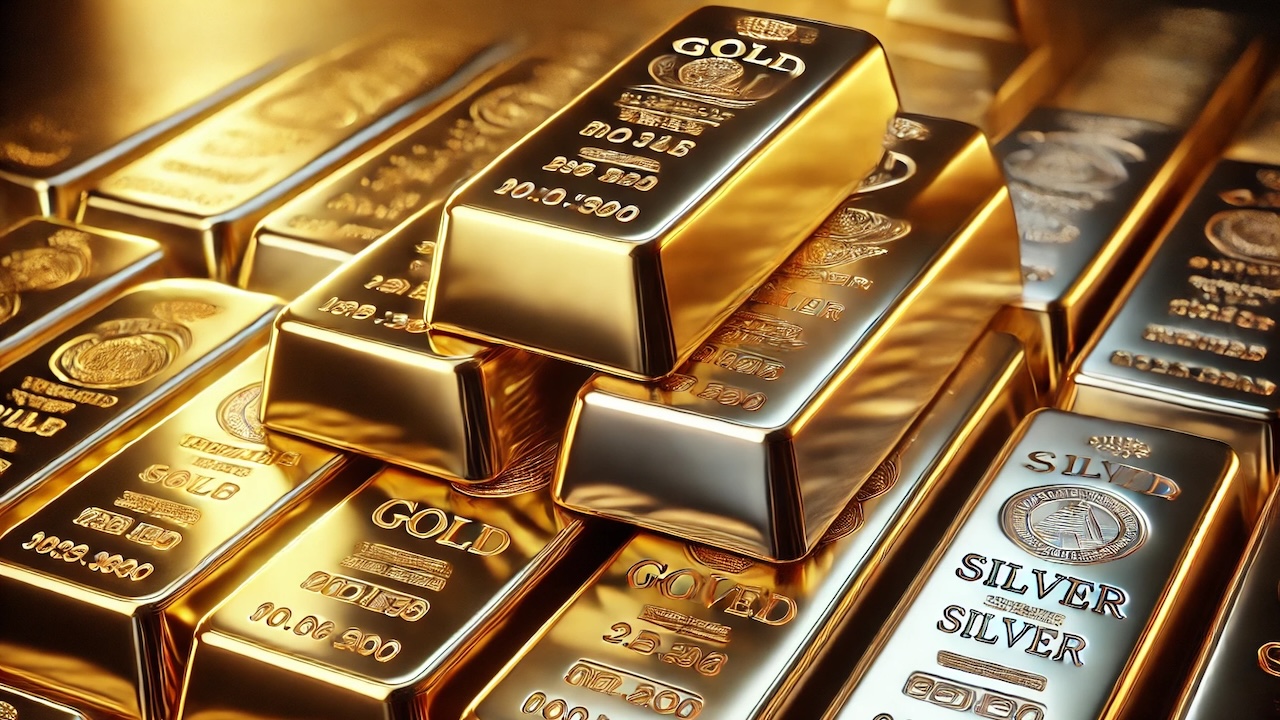
As we approach the end of 2024, the precious metals market has witnessed an extraordinary surge, with gold and silver emerging as the two best-performing assets of the year. By the end of October, silver had soared by an impressive 42.4 percent, while gold followed closely behind with a remarkable 33.7 percent increase. In comparison, the NASDAQ, the leading stock index, managed a respectable 24 percent gain, highlighting the exceptional performance of these metals.
Gold Shining Bright
Gold has continued to shine brightly in 2024, posting another 4 percent increase in dollar terms during October alone. This upward trajectory has not only been evident in the U.S. dollar but across various major currencies, showcasing gold’s global appeal.
A closer examination of gold’s performance reveals that it has reached an astonishing 39 all-time highs this year. The only year that surpassed this record was 1979, when gold broke its own record 57 times. Notably, gold also hit 38 record highs in both 1972 and 2011.
The World Gold Council has pointed out some significant differences between the current gold bull run and previous record-setting years. Historically, such surges have been accompanied by strong investment demand; however, this year, gold ETF inflows in Western markets have been notably late to the party, and retail investment demand has not seen a substantial uptick.
In a remarkable turn of events, gold also established its all-time inflation-adjusted high this year, surpassing the previous record set in 1980. This achievement is particularly noteworthy given the positive performance of risk assets, a relatively strong dollar, and rising Treasury yields—factors that typically create headwinds for gold.
Interestingly, the World Gold Council has observed a lack of media hype surrounding gold’s stellar performance this year. Unlike the fervor seen in 2020 when gold made its first new all-time highs in nearly a decade, the current sentiment appears more subdued, suggesting that investors are not getting carried away.
The trading dynamics in the East have played a crucial role in driving gold’s price action. Analysis from the World Gold Council indicates that gold’s price movements have primarily occurred during late Asian and early European trading hours. This trend helps explain the disconnect between gold’s returns and the usual U.S.-centric short-term drivers of rates and the dollar.
In contrast, trading during U.S. and European hours has been more volatile, consistent with the narrative that emerging market investors and central bank buying are propelling prices higher, even as Western markets create short-term noise.
Despite the soaring prices, gold demand reached a record high in the third quarter of 2024. Including over-the-counter (OTC) sales, gold demand totaled 1,313 tons, marking a 5 percent year-on-year increase. The World Gold Council has identified several factors that could sustain the gold bull run, including elevated geopolitical risks, overvalued equity markets, low Western investor gold ownership, and ongoing central bank purchases.
Silver Lost in Gold’s Spotlight
While silver has outperformed gold this year, it often finds itself overshadowed by its more illustrious counterpart. Despite its impressive gains, silver remains significantly below its all-time high, and the gold-silver ratio continues to hover above 80-1, indicating that silver is historically underpriced compared to gold. This disparity suggests that silver may be poised for a significant upward movement.
Many long-term investors still perceive silver primarily as an industrial commodity, with industrial demand accounting for more than half of silver’s offtake. This perspective is particularly relevant given the booming industrial demand for silver. In 2023, industrial offtake reached a record 654.4 million ounces, and analysts anticipate that industrial demand will again hit record levels in 2024.
The combination of robust demand and lagging silver mine output has resulted in market deficits for three consecutive years, with expectations that demand will once again outstrip supply this year.
From a technical standpoint, silver’s price chart presents a bullish outlook. A 50-year price chart reveals a distinctive pattern known as a “secular cup and handle.” This long-term bullish pattern features a “cup” formed by twin highs of around $50 per ounce in 1980 and 2011, followed by a sharp decline and subsequent consolidation, creating the “handle.” Such patterns often precede significant breakouts, and given the historical context, longer patterns tend to portend larger price movements.
Interestingly, gold has followed a similar long-term pattern, culminating in a breakout to new all-time highs last year. For investors who remain bullish on gold, it is prudent to also consider silver. While silver’s industrial applications contribute to its volatility, it has historically tracked closely with gold over time. In fact, during gold bull runs, silver has often outperformed its golden counterpart.
As we look ahead to 2025, the backdrop for gold investment remains solid, and the potential for silver to follow suit is promising. With a combination of strong industrial demand, favorable technical patterns, and the historical tendency for silver to rally alongside gold, investors may find themselves in an advantageous position as the precious metals market continues to evolve.
In conclusion, 2024 has been a remarkable year for both gold and silver, with each metal carving out its own narrative in the financial landscape. As we move forward, the interplay between these two precious metals will be fascinating to watch, and investors would do well to keep a close eye on their developments.


